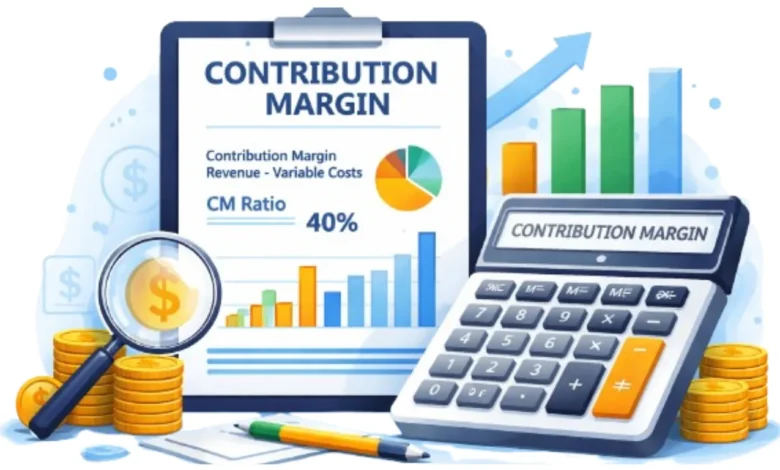
If you want to know how to find contribution margin, subtract total variable costs from sales revenue. The result shows how much money remains to cover fixed expenses and profit. You can calculate it for your entire business, one product, or each unit sold.
Direct answer: Contribution margin equals sales revenue minus variable costs. For example, a product selling for $100 with $60 in variable costs has a $40 contribution margin. Divide $40 by the $100 selling price to get a 40% contribution margin ratio.
| Calculation | Formula | What It Tells You |
|---|---|---|
| Total contribution margin | Sales revenue − variable costs | Dollars available for fixed costs and profit |
| Contribution margin per unit | Selling price − variable cost per unit | Amount each sale contributes |
| Contribution margin ratio | Contribution margin ÷ sales revenue × 100 | Percentage of each sales dollar remaining |
| Break-even units | Fixed costs ÷ contribution margin per unit | Units needed to cover all costs |
What Is Contribution Margin?

How to Find Contribution Margin margin measures the revenue remaining after a business pays its variable costs. Those remaining dollars first pay fixed expenses, such as rent and insurance. Any amount left after fixed costs becomes operating profit.
Variable costs change as sales or production volume changes. Common examples include materials, packaging, shipping, sales commissions, and transaction fees. Fixed costs normally remain stable within a relevant operating range.
This distinction makes contribution margin useful for day-to-day management decisions. It can help owners evaluate pricing, discounts, products, customers, and expansion plans. BusinessVert’s guide on how to succeed in business also highlights margins and cash control as important business measures.
How to Find Contribution Margin in 4 Steps
How to Find Contribution Margin metric is simple once your costs are classified correctly. The harder part is deciding which expenses change with each additional sale. Follow these four steps using records from the same accounting period.
1. Determine Your Sales Revenue
Start with the revenue generated by the product, service, or business segment you want to analyze. Use net sales when refunds, returns, or allowances materially reduce reported revenue. Keep the period consistent with the expenses used in the calculation.
For a single product, you can use its selling price instead. Suppose your company sells an item for $80 per unit. That $80 becomes the starting point for the per-unit calculation.
2. Identify the Variable Costs
Next, add the expenses that increase or decrease with sales activity. These may include materials, piece-rate labor, shipping charges, payment processing fees, and sales commissions. The exact categories depend on how your business operates.
Avoid subtracting fixed expenses during this step. Office rent, annual insurance, and many salaried administrative costs usually belong outside the calculation. Misclassifying these expenses can produce a misleading result.
3. Subtract Variable Costs From Revenue
Use the basic contribution margin formula:
Contribution margin = Sales revenue − Variable costs
Assume the $80 product has $48 in variable costs. Subtracting $48 from $80 leaves a $32 contribution margin per unit. Each unit therefore provides $32 toward fixed costs and eventual profit.
You can apply the same formula to total monthly results. If sales equal $200,000 and variable expenses equal $120,000, the total contribution is $80,000. That amount must cover the company’s fixed expenses before it generates operating profit.
4. Calculate the Contribution Margin Ratio
A dollar amount is useful, but a percentage makes comparisons easier. Divide the contribution margin by sales revenue and multiply the result by 100. This percentage is called the contribution margin ratio.
Using the earlier example, divide $32 by the $80 selling price. The result is 0.40, or 40%. That means 40 cents of each sales dollar remains after variable expenses.
The ratio becomes especially helpful when comparing products with different prices. A $100 product may produce more contribution dollars but a lower percentage than another product. Reviewing both measures gives you a clearer picture.
Contribution Margin Example for a U.S. Small Business
Consider a U.S. online retailer selling insulated bottles for $50 each. Materials, packaging, fulfillment, payment processing, and sales-related costs total $30 per bottle. The contribution per bottle is therefore $20.
The contribution margin ratio is 40% because $20 divided by $50 equals 0.40. If the retailer sells 2,000 bottles, total sales equal $100,000. Total variable costs equal $60,000, leaving $40,000 for fixed costs and profit.
Suppose monthly fixed costs are $28,000. Subtracting them from the $40,000 contribution leaves $12,000 in operating profit. This example shows why sales revenue alone cannot tell an owner how profitable each additional sale may be.
Contribution Margin vs. Gross Margin
Contribution margin and gross margin answer different financial questions. Gross margin generally focuses on revenue after cost of goods sold. Contribution margin calculations subtract all variable expenses associated with generating sales.
A sales commission, fulfillment fee, or card-processing charge may be variable without appearing inside traditional cost of goods sold. Including those expenses can make the contribution figure more useful for product and pricing decisions. The correct treatment depends on your accounting structure.
This difference matters when managers evaluate individual products or customers. BusinessVert’s article on the growing role of accountants in advisory services discusses how pricing and margin analysis can support better decisions. Organized financial reporting can reveal which offerings deserve more attention.
| Measure | Main Calculation | Best Used For |
|---|---|---|
| Contribution margin | Revenue − all relevant variable costs | Pricing, break-even, product decisions |
| Gross profit | Revenue − cost of goods sold | Financial reporting and production profitability |
| Net profit | Revenue − all business expenses | Overall bottom-line performance |
How Contribution Margin Helps You Find the Break-Even Point
Contribution analysis becomes especially valuable when calculating break-even sales. The break-even point occurs when total contribution exactly covers fixed costs. At that point, the business has neither an operating profit nor an operating loss.
For units, divide fixed costs by the contribution margin per unit. A company with $30,000 in monthly fixed costs and $15 contribution per unit needs 2,000 unit sales. Sales above that level begin contributing toward operating profit.
You can also calculate break-even revenue using the contribution margin ratio. Divide fixed expenses by the ratio expressed as a decimal. A company with $40,000 in fixed costs and a 40% ratio needs $100,000 in revenue to break even.
What Is a Good Contribution Margin?
There is no universal percentage that makes a contribution margin automatically good or bad. Cost structures vary widely between software, retail, manufacturing, professional services, and restaurants. A useful benchmark must reflect your business model and fixed expenses.
A higher percentage usually leaves more revenue available for fixed costs and profit. Still, a high percentage does not guarantee a profitable company. Large fixed expenses can consume the available contribution quickly.
Track your own ratio over several months instead of focusing only on one benchmark. Compare products, services, and customer groups using consistent cost classifications. This approach can expose changes before they create larger profit problems.
Business owners who need more detailed analysis may also benefit from professional financial reporting. BusinessVert explains several CPA services that can drive profitability, including regular profit reviews. Reliable reporting makes margin decisions easier to defend.
Common Contribution Margin Mistakes
The most common mistake is treating fixed costs as variable costs. That can understate contribution and distort comparisons between products. Classify expenses according to how they behave as activity changes.
Another mistake is ignoring variable selling expenses. Commissions, shipping, marketplace charges, and payment fees can reduce the economic value of each additional sale. Leaving them out may make an offer look stronger than it is.
Businesses should also avoid using contribution margin as a replacement for net profit. Contribution shows what remains before fixed costs are deducted. Net profit reflects the result after the broader expense structure is considered.
Finally, use consistent periods and accounting definitions. Comparing one month’s net sales with another period’s expenses creates an unreliable result. Clean bookkeeping and regular reviews help prevent these mismatches.
How to Use the Result in Business Decisions
Start by comparing contribution dollars and percentages across products or services. An item with strong sales can still produce weak economics if variable costs are high. A smaller product line may deserve more attention if each sale contributes more.
Next, test how pricing changes affect the calculation. A discount may increase sales volume while reducing the amount available from every sale. Calculate the extra volume needed before approving a major discount.
You can also use the metric when evaluating advertising, outsourcing, suppliers, or new locations. BusinessVert’s guide to aligning finances with business goals explains why financial targets should connect with operating choices. The best decisions combine margin information with cash flow, demand, capacity, and long-term goals.
Use Contribution Margin as a Decision Tool
Knowing how to find contribution margin gives you more than another accounting number. It shows how much each sale contributes toward the expenses your business must pay regardless of volume. Used consistently, the calculation can improve pricing, product, and break-even decisions.
Review the metric alongside cash flow, net profit, and sales trends rather than using it alone. Recalculate it when prices or variable costs change materially. Better cost data usually leads to better operating decisions.
Frequently Asked Questions
How to find contribution margin from an income statement?
Start with sales revenue and identify the expenses that behave as variable costs. Subtract those variable expenses from revenue to calculate the total contribution. Traditional income statements may require extra detail because they do not always separate expenses by cost behavior.
What is the contribution margin per unit formula?
Subtract variable cost per unit from the selling price per unit. A $25 product with $10 of variable expense produces $15 per unit. That $15 helps cover fixed costs before becoming profit.
Is contribution margin the same as profit?
No, because contribution margin does not subtract fixed operating expenses. It shows the amount available to cover those expenses first. Profit remains only after applicable fixed and other expenses are deducted.
Can contribution margin be negative?
Yes, a negative result occurs when variable costs exceed the revenue generated by a sale. Each additional unit would then increase the operating loss before considering fixed expenses. Management should review pricing, cost structure, or whether the offering should continue.
Why is the contribution margin ratio useful?
The ratio converts the dollar calculation into a percentage of sales. This makes products with different selling prices easier to compare. It also supports break-even revenue calculations and pricing analysis.